In pursuit of the elusive discharge coefficient
Moderator: Team

Re: In pursuit of the elusive discharge coefficient
That's the point, D.C. Are worthless, cfm\sqin of valve area is the fast way to look at it. If the DC numbers from the flow bench are not accurate enough for the program it's time to rewrite the programs to eliminate the use of the DC number and stop wasting people's time chasing them.
BORN RIGHT THE FIRST TIME
-
groberts101
- Guru

- Posts: 1980
- Joined: Sat Mar 08, 2008 3:08 pm
- Location: Minneapolis
Re: In pursuit of the elusive discharge coefficient
Please elaborate a bit more as to why you think they are worthless.DrillDawg wrote: ↑Sun Jul 15, 2018 8:38 am That's the point, D.C. Are worthless, cfm\sqin of valve area is the fast way to look at it. If the DC numbers from the flow bench are not accurate enough for the program it's time to rewrite the programs to eliminate the use of the DC number and stop wasting people's time chasing them.
IMO, they have merit in the fact that they can denote how efficiently the valve curtain is being used when no pitot readings are being leveraged to measure flow around its periphery, which is rarely done by many porters. And beyond that they have the ability to denote when to look at other area's of the port shape(SSR) and sizing(mCSA) which may be hindering further DC gains. Need to always keep in mind that the curtain area can handle hella fast speeds compared to the upstream portions of any bent port. And the deeper the throats, bowls and higher the SSR apex.. the more venturi like they can become. Fill in that ever elusive short side curtain area even more than usual and the DC always improves.
IME, stagnation or sudden reversal of DC numbers usually points towards inefficient usage or major separation over the SSR, whether it be from much too small upstream mCSA(choke) and/or SSR shape related issues. On the older OEM castings it was usually a bit or even lots of both.
Another rhetorical way to see it. If DC starts heading down the toilet during static flow testing?.. what happens when the flow becomes much faster and starts moving dynamically?
-
David Redszus
- Guru
- Posts: 9633
- Joined: Tue Nov 27, 2007 9:27 am
- Location: Chicago
- Contact:
Re: In pursuit of the elusive discharge coefficient
I think that might be backwards. The concept of Cd is to indicate the efficiency of the port/valve under various pressure and lift conditions. A flow bench is not capable of producing the pressure ratios found in an actual engine.DrillDawg wrote: ↑Sun Jul 15, 2018 8:38 am That's the point, D.C. Are worthless, cfm\sqin of valve area is the fast way to look at it. If the DC numbers from the flow bench are not accurate enough for the program it's time to rewrite the programs to eliminate the use of the DC number and stop wasting people's time chasing them.
A flow bench flow measurement has no relation to actual engine flow; it is only an approximation. CFD numbers are totally invalid since they do not represent air mass and do not relate at all to the exhaust. The simulations are not wrong; they may be incomplete and inaccurate because the entered data is wrong.
The problem remains: how to determine the Cd of components utilized in the gas exchange process.

Re: In pursuit of the elusive discharge coefficient
I think you need to rephrase the question in the following way:
If I have x dollars to spend on it, what's the best way to estimate the Cd(lift, pressure ratio) map for a port?
And then ask it for multiple budget points x. I would define best here as minimizing the simulation error for the relevant part of the power curve, which automatically gives more weight to those lift and pressure ratios at which a lot of mass air flows in a running engine.
Flow bench CFM at 28" of water (or about 1.07) is going to be a frequent answer across many x values.
Paradigms often shift without the clutch -- https://www.youtube.com/watch?v=cxn-LxwsrnU
https://www.instagram.com/ptuomov/
Put Search Keywords Here
https://www.instagram.com/ptuomov/
Put Search Keywords Here
-
David Redszus
- Guru
- Posts: 9633
- Joined: Tue Nov 27, 2007 9:27 am
- Location: Chicago
- Contact:
Re: In pursuit of the elusive discharge coefficient
I don't know what that means. A pressure ratio of 1.07 (28" H2O) is seldom found in a race engine; and then only momentarily.Flow bench CFM at 28" of water (or about 1.07) is going to be a frequent answer across many x values.
Understanding engine air flow requires understanding a three dimensional map displaying PR, lift% and Cd; they are required to accurately compute (along with other variables) air mass.
Without an accurate air mass input, even the best simulation programs cannot be accurate.
But most are not really intended to be accurate; they are estimates and are descriptive, not predictive.
-
Stan Weiss

- Vendor
- Posts: 4813
- Joined: Tue Feb 20, 2007 1:31 pm
- Location: Philadelphia, PA
- Contact:
Re: In pursuit of the elusive discharge coefficient
Max bench depression will depend on the flow bench size and port size.
If I flow the head from 0.025" lift to max valve lift every 0.025" and from 5" of water to bench max every 5" of water at every lift point can I not generate either a series of spline curves or polynomial curves which should give a pretty good representation of discharge coefficient even for areas not mapped?
Stan
Stan Weiss/World Wide Enterprises
Offering Performance Software Since 1987
http://www.magneticlynx.com/carfor/carfor.htm
David Vizard & Stan Weiss' IOP / Flow / Induction Optimization Software
http://www.magneticlynx.com/DV
Offering Performance Software Since 1987
http://www.magneticlynx.com/carfor/carfor.htm
David Vizard & Stan Weiss' IOP / Flow / Induction Optimization Software
http://www.magneticlynx.com/DV
Re: In pursuit of the elusive discharge coefficient
What I mean is the following:David Redszus wrote: ↑Tue Jul 17, 2018 12:18 pmI don't know what that means. A pressure ratio of 1.07 (28" H2O) is seldom found in a race engine; and then only momentarily.Flow bench CFM at 28" of water (or about 1.07) is going to be a frequent answer across many x values.
Understanding engine air flow requires understanding a three dimensional map displaying PR, lift% and Cd; they are required to accurately compute (along with other variables) air mass.
Without an accurate air mass input, even the best simulation programs cannot be accurate.
But most are not really intended to be accurate; they are estimates and are descriptive, not predictive.
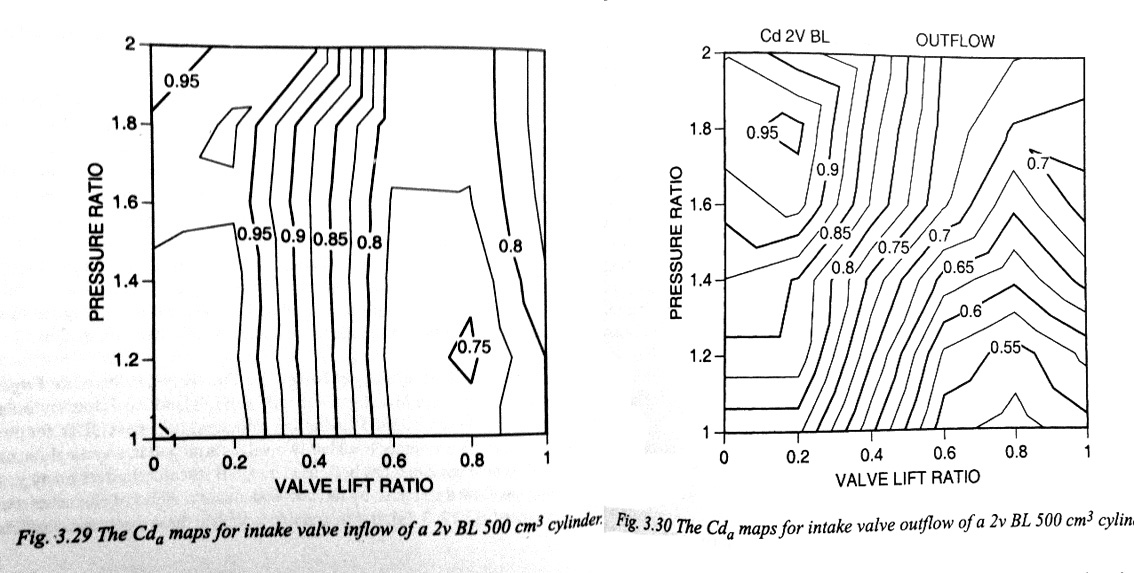
Take the SCFM @ 28" flow bench curve and use it to compute the Cd as well as you can, knowing the geometry. Then, assume that the Cd is constant across pressure ratios per each lift. You'll get a 3D contour map that's all straight vertical lines, which I claim is a reasonably good approximation for the intake.
If you want to spend more time/money, then flow the intake valve at different test pressures at each valve lift on the flow bench. There's a limit to how much the flow bench can pull, so some pressure ratios can't be tested. Those "there be dragons" unmappable pressure ratios will start at lower pressure ratios for high lifts and higher pressure ratios for low lifts. This process will allow you to get actual 3d contour map for low pressure ratios. For high pressure ratios, I suggest you simply extend the 3D contour map with straight lines up, by the force of assumption. Again, you didn't break the bank and I claim that the result is reasonably accurate.
Look at how straight those intake Cd lines are in the high pressure ratios when the valve is in the mid-lift region:
Paradigms often shift without the clutch -- https://www.youtube.com/watch?v=cxn-LxwsrnU
https://www.instagram.com/ptuomov/
Put Search Keywords Here
https://www.instagram.com/ptuomov/
Put Search Keywords Here
-
David Redszus
- Guru
- Posts: 9633
- Joined: Tue Nov 27, 2007 9:27 am
- Location: Chicago
- Contact:
Re: In pursuit of the elusive discharge coefficient
Not right at all. In order to obtain Cd values using a flow bench we need a wide range of pressure ratios, a calibrated orifice such as a flow nozzle and a method to measure the actual mass flow. The definition of Cd is the ratio of air mass that flows at a given pressure ratio compared to the air mass that should have flowed at that same pressure and area. Your method, as I understand it, simply graphs flow at various valve lifts. While you may assume that pressure ratio effects are constant at each lift point, that is simply not true. It is true, at certain area ratios, but not true for all area ratios and all engine geometries.Take the SCFM @ 28" flow bench curve and use it to compute the Cd as well as you can, knowing the geometry. Then, assume that the Cd is constant across pressure ratios per each lift. You'll get a 3D contour map that's all straight vertical lines, which I claim is a reasonably good approximation for the intake
That would work if the flow benches could produce sufficient pressure ratios, which they cannot. You need a bench that can produce about 205" H2O, to get realistic results and to examine exhaust valves. You still need to measure theoretical flow to be able to compare to actual flow. Look at how the various pressure ratios affect exhaust Cd values.If you want to spend more time/money, then flow the intake valve at different test pressures at each valve lift on the flow bench.
That would be wrong, since each engine is different, a point made ad nauseum by Blair. Notice the totally different contours produce by the intake inflow of the Honda engine. (Blair, Page 358)For high pressure ratios, I suggest you simply extend the 3D contour map with straight lines up, by the force of assumption.
The bank has nothing to do with all this. If you cannot accurately measure Cd under limited conditions, then you have no ability to understand what occurs under other operating conditions. Not only is your procedure not reasonably accurate, it is totally wrong.Again, you didn't break the bank and I claim that the result is reasonably accurate.
You may want to re-read Blair, Four stroke engines, Chapt 3.
What would be very helpful is if we could see the Cd plots as three dimensional; similar to a topographical map.
Re: In pursuit of the elusive discharge coefficient
I’m obviously failing to communicate what I mean so let me post a numerical example tomorrow.
Paradigms often shift without the clutch -- https://www.youtube.com/watch?v=cxn-LxwsrnU
https://www.instagram.com/ptuomov/
Put Search Keywords Here
https://www.instagram.com/ptuomov/
Put Search Keywords Here
Re: In pursuit of the elusive discharge coefficient
Here's what we did. First, we measured or computed three areas. The areas are (1) the port minimum cross-sectional area around the valve guides, (2) the valve seat "throat" area adjusted for the valve stem, and (3) the valve curtain area. The first doesn't depend on the lift, the second doesn't depend on the lift in the relevant valve lift range, and the third _does_ depend on the lift. Then, we computed the minimum cross-sectional area at each lift simply as the minimum of the three. The theoretical flow at each lift we defined as SCFM that a very efficient orifice with venturi-like transitions would flow at the flow bench test pressure. The actual flow in SCFM we just got from the flow bench. We defined Cd as the ratio of actual SCFM to the theoretical SCFM. What we found was that Cd, defined in this way, did depend on the test pressure for very low lifts. For medium and high lifts it was relatively constant and whatever variation we saw was probably within the bounds of our measurement error. The head was a Porsche 928 S4 head, many years ago. Whether what we did was right or wrong is up to debate, and to what extent those Cd values can or should be used as 1D simulation valve Cd's is up to even more debate.
There's always a way to complicate a procedure like this. For example, take a look the following reference: Blair, G. and Drouin, F., "Relationship Between Discharge Coefficients and Accuracy of Engine Simulation," SAE Technical Paper 962527, 1996, https://doi.org/10.4271/962527.
Blair and Drouin sneer at procedures such as the above-described procedure that we used. They do propose an alternative way to measure Cd on a flow bench for the purposes of 1D simulations. They think their method is better than our naive method. Since I don't really have the capacity to evaluate their method critically, I'll take their word for it.
Interestingly, what they find is that... drumroll... at high lifts, their best estimate of Cd is approximately independent of the test pressure ratio! For example, for an intake valve with 22mm inner seat diameter flown into the cylinder, they find that at 5mm lift the estimated Cd at 1.07x pressure ratio is about 0.75-0.76 and at 1.60x pressure ratio about 0.75-0.76! That's a frigging constant in my book. Similar results for 6mm and 7mm lifts.
Outflow Cd (intake port flown the wrong way) is more variable with pressure ratio. But if you flow a lot of air mass backwards in the intake between the peak torque rpm and the peak power rpm, you're doing something different from what I'm trying to do. Like Miller/Atkins cycle or something.
Paradigms often shift without the clutch -- https://www.youtube.com/watch?v=cxn-LxwsrnU
https://www.instagram.com/ptuomov/
Put Search Keywords Here
https://www.instagram.com/ptuomov/
Put Search Keywords Here
Re: In pursuit of the elusive discharge coefficient
Would you have to account for the mass of the fuel as well for the mass of the air in a running engine, maybe lbs\min. total mass?
BORN RIGHT THE FIRST TIME
-
David Redszus
- Guru
- Posts: 9633
- Joined: Tue Nov 27, 2007 9:27 am
- Location: Chicago
- Contact:
Re: In pursuit of the elusive discharge coefficient
Perhaps a better understanding of Cd is useful.
A commonly used term in engine development is "Volumetric efficiency", which has nothing to do with volume at all.
It is the ratio of actual mass flow divided by the theoretical mass flow through an orifice of the same size and under the same conditions. It represents the global efficiency of the engine gas exchange process.
Discharge coefficient (Cd) is very similar except its focus is on specific components of the induction and exhaust system.
Every component that flows air will have a Cd, both at its entry and exit areas. This includes carbs, throttle plates, air filters, etc. Using an analysis incorporating CD we can evaluate and optimize each component individually.
Bench flow measurements are commonly performed on a test bench with a steady state air flow, at a constant and low pressure ratio; sometimes using a range of valve lifts.
This presents several problems.
The air in an actual running engine is not steady state but is pulsed. These pulses produce superposition pressures that exceed static or average pressures in the duct system.
The low test pressure ratios of the flow bench are nowhere near those found in an actual engine; not even close. The air mass is significantly affected by PR due to turbulence, surface friction effects and compressibility. These factors alone are enough to invalidate measured numbers.
Flow measurements must be in mass units, not volumes or velocities converted to some standard density. They must reflect actual temperature and pressures found in the system.
Dry air measurement does not reflect the true characteristics of air with fuel vapors; this includes the exhaust mass flow as well.
Valve curtain area, determined by valve size and lift, do not completely determine air resistance to flow. The radial air flow exiting the valve perimeter, impacts the cylinder bore or is shrouded by other valves and chamber contours.
If the intent is merely to compare the efficacy of several ports in the same head, or ports of similarly sized heads, then the commonly used flow bench procedures are adequate, as confirmed by Blair and others. But if the application calls for the data to be entered into a simulation program that will calculate air mass flow (including fuel vapor) across a broad range of operating and load conditions, then current practice is inadequate and result in unacceptable output error.
Test benches can be modified to produce acceptable levels of accuracy. If the curtain area at each tested lift point is determined and a calibrated orifice (either sharp edged or ASME calibration nozzle) of same area is used to determine air mass flow at various pressure ratios as the ideal or optimum value, it can be compared to the actual mass flow using an air mass flow sensor.
Once the Cd is known for a range of areas and pressures, the engine simulation program can calculate the gas exchange process with a much higher degree of precision. Not too far away, CFD will be added to assist in the process of understanding of not just what but why engines behave as they do.
Now if we could only develop a test bench to predict female behavior....
Re: In pursuit of the elusive discharge coefficient
205" vacuum is about 0.5 bar abs. If the upstream pressure is 1 bar the PR is 2.0David Redszus wrote: ↑Tue Jul 17, 2018 5:04 pmYou need a bench that can produce about 205" H2O, to get realistic results and to examine exhaust valves.
If you look at the image on the left of ptuomov's post above you can see that it maps Cd at PR up to 2.0. You can also see that that particular valve exhibits similar flow behaviour at all PR's from 1.0 to 2.0 The error associated with using ptuomov's method would be a few percent at most and much less over most of the range.